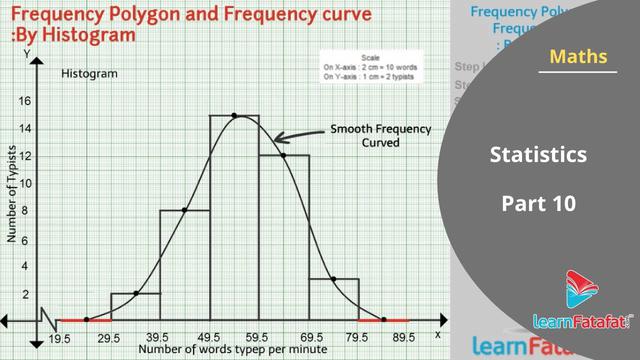
Frequency curve
The probability distribution curve commonly used in hydrological statistics calculation includes normal distribution and Pearson type III curve. The density function of the normal distribution is f(x)=1σ2πe-(x-x)2[]2σ2. In the formula: σ is the mean square error; e is the base of the natural logarithm. The characteristics of the normal distribution are often used in error estimation. The Pearson Ⅲ distribution curve is an asymmetric unimodal curve with a finite end and an infinite end. Its density function is f(x)=βαr(α)(x-a0)a-1e-β(x-a0). In the formula: r(α) is the gamma function of α; α, β, and a0 are three parameters. The three parameters have the following relationship with the distribution parameters (or statistical characteristic values): α=4C2s; β=2xCs; a0=(1-2CvCs) where: Cs is the coefficient of deviation; Cv is the coefficient of variation. After the three parameters are determined, the density function is determined accordingly. In China's hydrological practice, the frequency analysis of hydrological variables mostly uses the Pearson III distribution curve to estimate.

Latest: TransFlash card
Next: Built-in TV


